Living Vista Experience™ | Creating interactive Brand experiences
Analytics
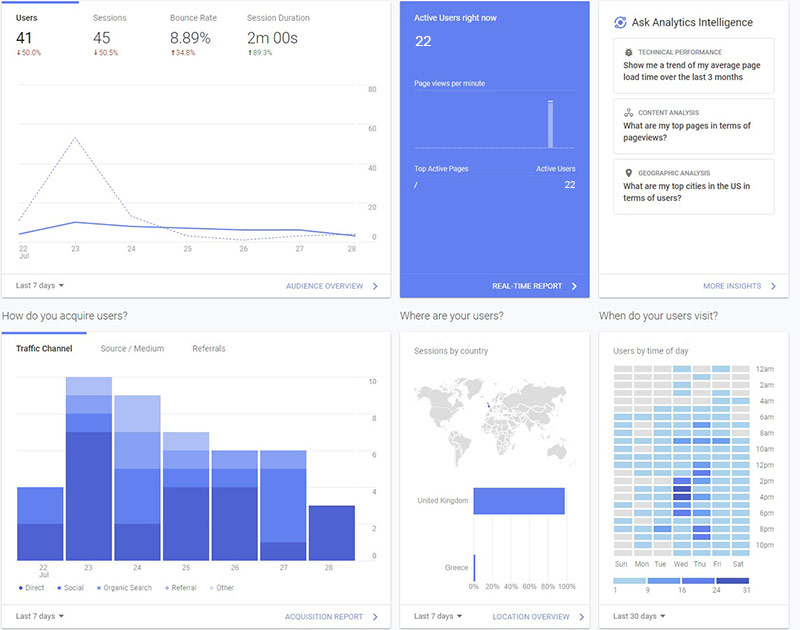
Real-time analytics and historical performance data reveal how visitors to a Living Vista Experience™ Virtual Tour are interacting with features & what paths they follow.
Advanced Analytics
After investing in the production of your Living Vista Experience™ virtual tour, it is crucial to know how well it’s performing, what paths and flows your audience follows and what works and what doesn’t in terms of hotspot clicks, most viewed vistas etc.
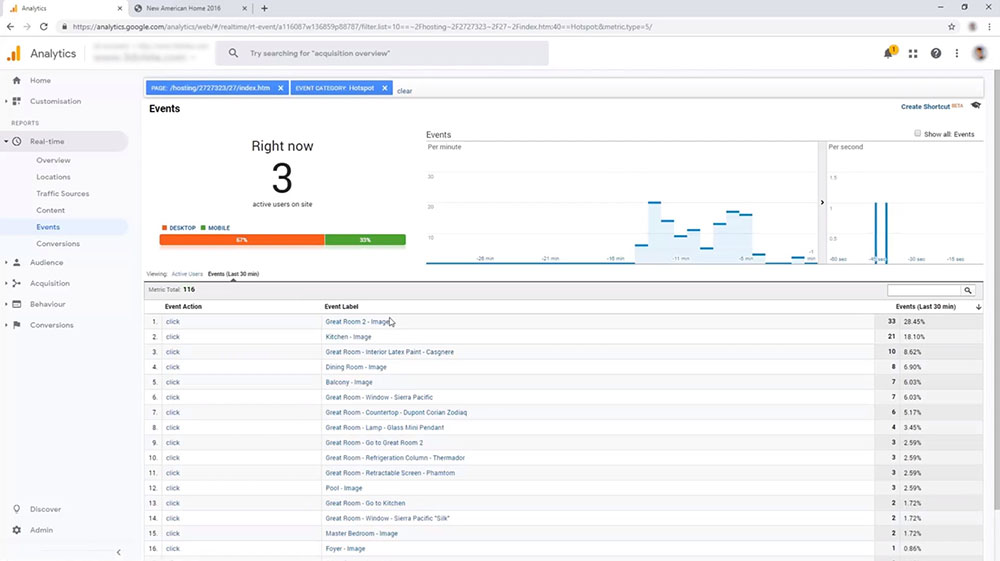
The advanced analytics feature monitors and tracks the detailed behaviour of your visitors whilst they are exploring the Living Vista Experience™. Reports can be generated that analyse user interaction with the skin interface elements, hotspots and media.
A ranking table is produced showing which buttons are clicked most often and which vistas are entered, together with a breakdown of how this perhaps varies for visitors from different geographical regions. It’s quickly possible to discover which parts aren’t being accessed for some reason and to implement corrective measures. For example, simply highlighting a hotspot in a different way might means it attracts more attention.
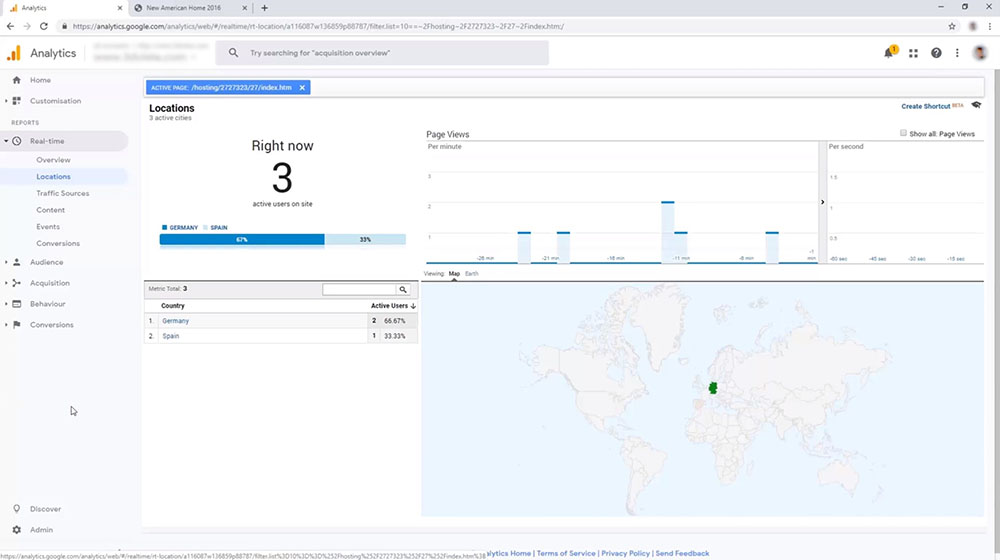
You can even see where visitors come from and which nationality tends to follow which flow through the LVX virtual tour. These are all valuable insights for marketing, audience analysis and performance improvements.
Realtime Overview
The Realtime overview report provides visibility for exactly what each visitor is viewing at that moment in time. A ranking table of all the LVX elements provides a quick way of assessing the most popular features in the virtual tour. In addition to a tabular format, data can be graphically presented in pie or bar charts.
Flow map
The flow map makes it possible to follow a visitor’s journey through the Living Vista Experience™ virtual tour. The granularity of the data allows for analysing how different classifications of visitor explore. For example, it’s possible to differentiate between geographical locations, gender, the type of computing device being used, etc. This kind of information is vital to ensure the target audience is experiencing the site in the way it was intended.
Geographical Data
The analytics engine provides a geographical overview of where visitors to your LVX site are located, often down to a city level.